Posts

Showing posts from February, 2023

GIS 6005 - Proportional Symbol and Bivariate Choropleth Mapping
Image
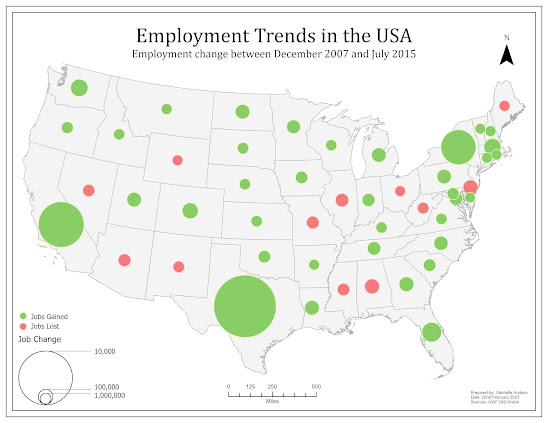
 While there are many ways to display data on a map, proportional symbol and bivariate choropleth mapping can be considered two methods that are technically challenging but significantly beneficial when executed correctly. The challenges proportional symbol maps can introduce include, but is not limited to, overlapping symbols, symbols that do not have enough variation in size, and accurately displaying positive and negative values. One of the maps created for this week's lab, as seen below, is an example of a proportional symbol map that has both positive and negative values. To properly display both sets of values, the GIS professional has to create additional attribute fields that separate the positive and negative values, followed by making the negative values positive. Once this is done. The data can be symbolized and displayed effectively.  Alternatively, bivariate choropleth mapping involves showing the relationship between two data variables. This is particularly beneficial

GIS 6005 - Analytical Data

Image
When we think about using GIS to communicate information it can often be done with a single map. However, we often require additional 'help' relaying that information. This help can be in the form statistics and various graphs, which are derived from analysis of raw data. When the supplemental statistics and graphs are, then, combined with a map or multiple maps we create an infographic. The task for students this week was to create our own infographic that includes two maps, multiple charts and statistics stated in text format. The infographic I created highlights the relationship between smoking and reports of fair or poor health.  To create this infographic, data from County Health Rankings was combined with existing county GIS data to create two choropleth maps. The first map displays the percentage of adult smokers by county and the second map shows the percentage of adults that reported their health to be fair or poor. The maps are accompanied by two pie charts, a scatter

GIS 6005 - Color Concepts and Choropleth Mapping

Image
 Module 4 of Communicating GIS took students on a journey of color. This week we learned the extent at which color impacts a map and the information being communicated. We have had to take into consideration which colors usually or best represent specific types of data, how the human eyes interpret color, how colors interact with each other, and the ways color can vary in hue, saturation and lightness of value. While we focused on the RGB and HSV color systems, we also explored displaying quantitative data and using color ramps to symbolize sequential and divergent data.  The following images show three color ramps. All of the color ramps were created using the RGB color system, however, each was created utilizing a different method. The first ramp was created by choosing the darkest and lightest hues, followed by determining the 4 shades in between at an equal interval. The second ramp utilized the same darkest and lightest hue, but the 4 shades in between were determines using interv

GIS 6005 - Terrain Visualization

Image
 As indicated in the title of this blog post, Terrain Visualization was the topic for this week's module. This means that we primarily focused on utilizing various types of elevation data, including raster based Digital Elevation Models (DEMs), contours and Triangular Irregular Networks (TINs), to understand the terrain or the 'lay of the land'. This was supplemented by introducing techniques to better display elevation data such as creating a regular or multidirectional hillshade and masking contour labels. The following landcover map is an example of one of the products produced during this week's lab.  To better visualize Yellowstone National Park, I utilized a multidirectional hillshade under the landcover layer displayed at 50 percent transparency. This gives the map reader a better understanding of the various elevations and which types of land cover can be found at those elevations. The colors used for the various types of landcover generally match the landcover