Posts

Showing posts with the label GIS 5050

GIS 5027 - Intro to ERDAS Imagine and Digital Data

Image
  Map of classified subset of Olympic National Park The third week of Photo Interpretation and Remote Sensing introduced students to detailed information about Electomagnetic Radiation (EMR), the various types of remote sensors and the basics of Digital Image Processing. As such, the two part lab allowed students to put the newly acquired information to use. We were introduced to the ERDAS imagine software, where we learned the interface and some of the various functions that will be required for future use. The result of exploring the software is the map pictured above. We were tasked with creating a subset of a classified image, along with area calculations, which would be used in ArcGIS Pro to produce the map. 

GIS 5050 Week 7/8 - The Final Project

Image
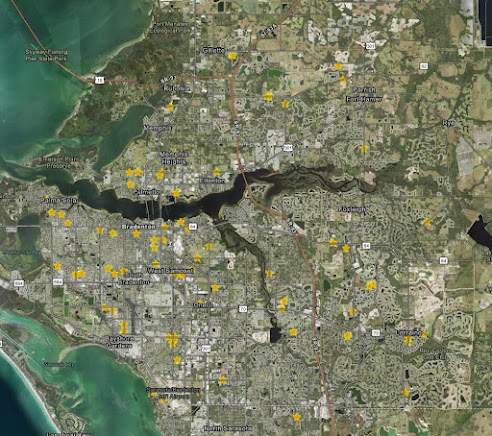
  The time has come. The end is here. It is the final week/s of GIS5050. As such, we were expected to complete a final project. For our final assignment we were tasked with performing an analysis of the Florida Power and Light (FPL) Bobwhite-Manatee Project Transmission Line, which allowed us to utilize the various skills we learned during the semester. To do this we had four criteria which included defining homes within proximity of the transmission line, schools within proximity of the transmission line, imposition of the transmission line on parcels and environmentally sensitive line, and determining the length of the transmission line. My map of environmentally sensitive land imposed on by the transmission line is displayed above. Once we completed our analysis we then had to present it in the form of a power point presentation or a story map. I chose to do a story map titled "FPL Bobwhite-Manatee Transmission Line Feasibility Analysis" . The final project was quite inter...

GIS 5050 Week 6 - Georeferencing, Editing & 3D

Image
  As the title of this blog post suggests, week 6 tasked students with georeferencing raster layers, editing two vector layers and using LiDAR data to produce a 3D map. Georeferencing raster layers proved to be quite an intricate process. It required identifying features on the raster image that matched the spatially accurate vector data. While choosing common features it was important to choose features that are static/stagnant or unlikely to change such as buildings or road intersections. Once a common feature was identified we input control points that would line the raster layer up with the spatially accurate vector layers. Once the raster layers were georeferenced, we then edited the buildings and roads layers. Using the georeferenced images of the UWF campus we digitized building 072 and Campus Lane. We also created a multiple ring buffer for a protected Eagles Nest on UWF campus property. The georeferenced images, digitized building and road, and the multiple ring buffer can...

GIS 5050 Week 5 - Adding XY Data Points and Geocoding

Image
  During week 5 the lab assignment had two parts. The first part of the assignment focused on adding XY data to a map and the second part of the assignment asked students to geocode school buildings in Manatee County, Florida. Both parts of the assignment taught students that data often comes in formats that are not "ready-made", such as shapefiles or feature classes. Often the data is tabular or has to be made tabular to be used in a GIS. For the first part of the assignment we input coordinate information into an Excel file and saved it as a CSV (Comma Separated Value) file that could be loaded in ArcGIS Pro. This also included using the Project Tool to give the data the appropriate projection/spatial reference.  Part two of the assignment, which focused on geocoding, was a bit more intensive. Once the raw tabular data about the schools in Manatee County, Fl, was obtained students had to modify the data in Excel to make it usable in an address locator. We were also introduc...

GIS 5050 Week 4 - Vector Analysis

Image
  Week 4 introduced students to Vector Analysis. Again, this lab was broken up into two parts. The first part of the lab helped students become familiar with geodatabases, spatial queries, attribute queries and proximities, all of which would be handy in the second part of the lab. I particularly enjoyed learning about the difference between a geodata base and a shapefile, and being introduced to the vast benefits of using a geodatabase, in particular the benefits in data management.  The second part of the lab taught students how to utilize various analysis tools such as buffer (compound and variable), union, intersect and erase. It also introduced concepts such as adding a field, calculate field and calculate geometry. All of these tools and concepts were used to determine potential camp sites in the De Soto National Forest, found near Hattiesburg, Mississippi (see map above).  Potential Camp Sites  needed to be within 150 meters of a lake or 500 meters of a river,...

GIS 5050 Week 3 - Data Collection with ArcGIS Field Maps and Projections

Image
  The lab assignment for week 3 was broken into two parts, Data Collection and Projections. The data collection exercise allowed students to become familiar with the process of creating, collecting and sharing data in various formats. We first created the dataset in ArcGIS Pro, ensuring that the proper domains were created and the appropriate attribute symbology was selected. We then collected the data utilizing ArcGIS Field Maps, which proved to make the data collection process quick and simple. For the data collection process I choose to collect benches along Montague Park and foreshore, in The Bahamas, and rank the quality from poor to excellent.  Lastly, we explored various ways to share the data we collected including an ArcGIS Online Web Map, KML files in Google Earth and a Map Package. The data collection exercise was both enjoyable and enlightening, and only unexpected but manageable aspect of the data collection exercise was interacting with persons who were utilizing...

GIS 5050 Week 2 - Cartography: Layout and Essential Map Elements

Image
For the second assignment students were tasked with creating a map highlighting the University of West Florida (UWF) Main Campus. The idea of the assignment was to help students become familiar with the map production process and all of the essential elements, from the first step of identifying the purpose of the map and the key points to the last step of exporting the map for use/viewing outside of ArcGIS Pro. Some of the other steps included reviewing the data and meta data, symbolizing the data layers, and ensuring all map elements were included.  In the map I created (pictured above), I choose to stick with gray tones for all of the background information and use a light green to display Escambia County, where the UWF main campus can be found. I then decided on a blue star to highlight the exact location of the campus because it matches the color of the school logo, displayed next to the map title. Also included is an inset map displaying all of Florida and highlighting Escambi...

GIS 5050 Week 1 - ArcGIS Pro Overview: Orientation

Image
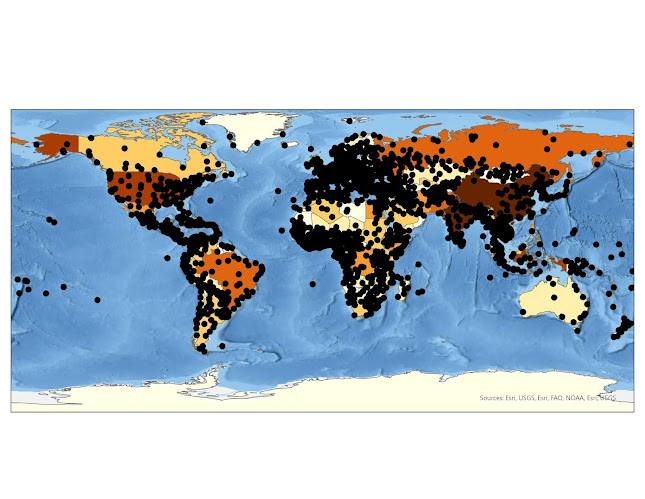
This week's assignment was geared toward becoming familiar with ArcGIS Pro, inclusive of the interface, basic functionality and setting up a project, and also learning to navigate the drives used to store and manage data and assignments. The familiarization process resulted in the map displayed above, which pinpoints various cities around the world. The map is missing many of the usual map elements, such as a legend, scale and north arrow, but they will be introduced in future assignments.  As someone who has some experience with ArcMap there was a bit of a challenge adjusting to the ArcGIS Pro, as I have to unlearn and relearn some of the tools. I am, however, looking forward to a more in depth look at the functions and tools, and learning the ins and outs of ArcGIS Pro, especially customizing maps.