Posts

GIS 5007 - Isarithmic Mapping

Image
 Isarithmic mapping is another type of thematic mapping that results in continuous phenomena of a geographic area being displayed using various symbology methods. The continuous phenomena typically displayed can include precipitation, elevation or topography. As it is difficult to record values for every single point across any given area, isarithmic mapping utilizes data from control points (true point data or conceptual point data) and interpolates the data using one of many interpolation methods to calculate the various intermediate points, producing a continuous surface. The interpolated data can then be symbolized to present as smooth surface using continuous tone or a stepped surface using hypsometric tinting. Contours can also be created and displayed as a stand alone feature or in conjunction with hypsometric tinting. Using the contours along with hypsometric tinting is recommended, however, because it helps the map reader obtain a better understanding of the data being dis...

GIS 5007 - Choropleth and Proportional Symbol Mapping

Image
 Expanding on last week's lecture and assignment, module 5 focused on choropleth mapping, dot mapping and proportional symbol mapping. Choropleth mapping displays phenomena that are aggregated to areas and are the most common type of thematic map. Most cartographers choose to utilize choropleth mapping when they want to display data that is evenly distributed across an enumeration district, however, it is important to refrain from using raw data. The data should be normalized to avoid presenting false narratives.  Dot mapping is also a type of thematic mapping. A dot map displays the location of one or more geographic occurrence or phenomena. Quite often one dot can represent a multiple occurrences of phenomenon, at which time the location of the dot is places in a relative position. Dot maps are easy for the reader to understand and can show variations of large quantities, however, it can be difficult to accurately interpret density.  Proportional symbol mapping consists...

GIS 5007 - Data Classification

Image
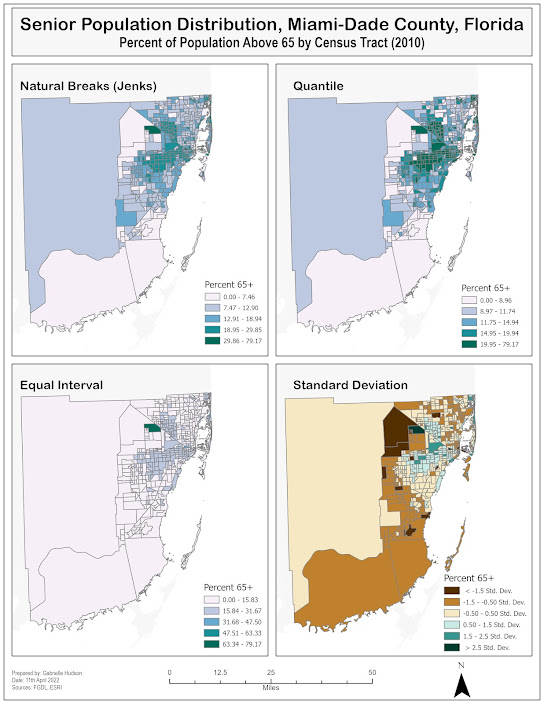
 Data classification is important when presenting data. It breaks raw data down into a more palatable and understandable format for the reader. It can also provide insight on and highlight patterns that may not have previously been visible. As such, this week we learned about various data classification methods. In the first instance we were introduced to the various types of data. They include qualitative data, which differentiates types of things and focuses more on characteristics, and quantitative data, which speaks to amount or magnitude. Once we learned of the various types of data we moved on to ways that data can be expressed, specifically via classification. The methods included: Equal Interval - classes are equal in range.  Natural Breaks - classes based on naturally occurring breaks in the data. Quantile - classes contain an equal amount of data in each class. Standard deviation - based on the mean and classes are formed based on deviation from the mean. Optimal Cla...

GIS 5007 - Cartographic Design

Image
This week's focus was land partitioning systems and cartographic design. Land partitioning systems can be broken into two categories, systematic and unsystematic. We were given a historic perspective of  both types of systems in the US and how they impact systems that are used today. The land partitioning systems were introduced to included Metes and Bounds, Long Lots, Spanish Land Grants, State Land Surveys, and the US Public Land Survey which is the most widely used land partitioning system in the USA today.   The cartographic design lesson introduced the 7 step map design process and elements required to produce a well designed map. To produce a well designed map, along with following the 7 step design process a cartographer has to be mindful of certain principles. Gestalt's design principles, inclusive of visual hierarchy, figure-ground relationship, contrast and balance, are all important.  Map of Ward 7 Public Schools Once we learned of the cartographic design ...

GIS 5007 - Typography

Image
During week 2 of the Cartography course we were introduced to typography, generalization and scale conversion. Typography refers to the art of arranging, using and designing type. This is important as type can influence the way information on a map is communicated to the reader. Generalization refers to the process of aggregating data on a map, in various ways, to reduce congestion, conflict and complication. This is also important in ensuring that the map produced is legible to the reader, in particular when reducing the scale of a map. As it relates to scale conversion, the importance of understanding scale conversion presents itself when a map may contain a scale that does not match the intended use of the map user/reader.  We also continued to learn about essential map elements, inclusive of a map title, scale bar, north arrow (orientation), legend, data source, author and production date. The map below, of Florida, includes the various essential map elements and labels in acco...

GIS 5007 - Map Critique

Image
This week's assignment tasked students with critiquing two maps, a well-designed and a poorly designed map, based on what we learned this week about cartographic concepts. These concepts included the 20 Tuftisms, which were broken down into 6 commandments. The commandments include the following:  Map substantial information;  Don't lie with maps;  Effectively label maps;  Minimize map crap;  Map layout matters; and  Evaluate your map.  The map I chose as a well-designed map is "The Global Religious Composition Landscape".  At a first glance the map is esthetically pleasing to the eyes. The author utilized neutral colors for the background and brighter colors to highlight the various religions, while limiting the information present to the 7 predominant religions of the world to prevent overwhelming the reader. This map includes all of the important map elements, except for a scale bar/text, which is seemingly the only down fall. The labels are con...

GIS 5007 - Hi! My name is Gabrielle.

Image
Hi! As stated in my title, my name is Gabrielle. I am currently a part time student in the MSc. Geographic Information Science Administration program at the University of West Florida (UWF), but I'm also a full time employee at the Bahamas National Geographic Information Systems (BNGIS) Centre, in The Bahamas. My official position is GIS Analyst and GI Education Coordinator, however due to the small staff compliment we all wear many hats. Some of my responsibilities include maritime delimitation, disaster preparedness and response, training, mentoring, data collection and data management. I decided to pursue a masters level degree with the hope of increasing my knowledge in GIS, which will better prepare me for future opportunities at my current place of employment, or where ever the opportunity may present itself. The degree option at UWF seemed to perfectly match my goal of future advancement as it also includes a management aspect.  To learn a little more about me you can visit ...