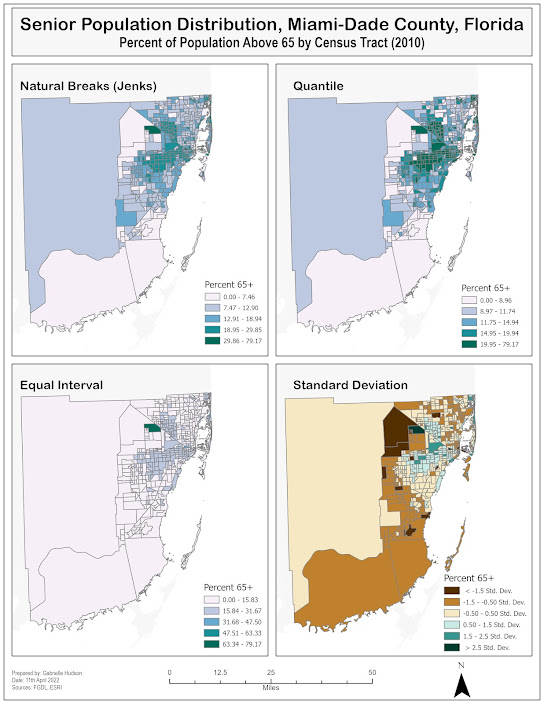
GIS 5007 - Data Classification
Data classification is important when presenting data. It breaks raw data down into a more palatable and understandable format for the reader. It can also provide insight on and highlight patterns that may not have previously been visible. As such, this week we learned about various data classification methods. In the first instance we were introduced to the various types of data. They include qualitative data, which differentiates types of things and focuses more on characteristics, and quantitative data, which speaks to amount or magnitude. Once we learned of the various types of data we moved on to ways that data can be expressed, specifically via classification. The methods included:
- Equal Interval - classes are equal in range.
- Natural Breaks - classes based on naturally occurring breaks in the data.
- Quantile - classes contain an equal amount of data in each class.
- Standard deviation - based on the mean and classes are formed based on deviation from the mean.
- Optimal Classification Method - classes include similar data values by minimizing an objective measure of classification error.


Comments
Post a Comment