GIS5100 - Crime Analysis
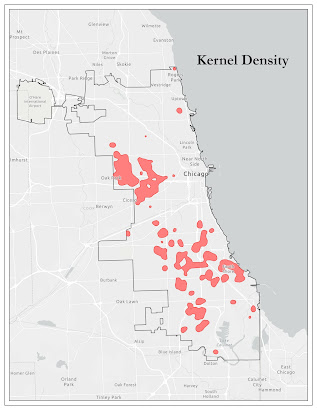
As the title suggests, the first module of the GIS5100- Applications in GIS course introduced students to Crime Analysis. To analyze crime we learned various ways to locate hotspots based on historic data. Hotspots for the purpose of crime analysis refers to areas of concentrated crime. While there are many ways to determine where hotspots are we focused on learning how to use the Grid Overlay, Kernel Density and Local Moran's I methods. Learning the application of crime hotspot analysis is important because it is utilized by many crime fighting agencies around the world and has been proven to be an effective tool in decreasing crime and efficiently allocating resources. Hotspot analysis can also be used to determine hotspots in other walks of life, including but not limited to health pandemics, road traffic incidents and habitat management.
The following maps are a result of the crime analysis completed during this week's exercise. We were tasked with determining crime hotspots in Chicago based on 2017 homicide data.


Comments
Post a Comment