GIS 5100 - Forestry and LiDAR

The second module of the Applications in GIS course introduced students to Watersheds and LiDAR. While I have previously been exposed to LiDAR, I had not had the opportunity to work with LiDAR data and manipulate it until this module. As such, it was exciting to be able to get this opportunity to learn about it. This week's lecture focused more on watershed analysis, while the lab focused on using LiDAR. The lab tasked students with creating a Digital Elevation Model (DEM) and Digital Surface Model (DSM), calculating forest height and calculating biomass. Below are maps that were produced as a result of the lab assignment. 

Map of Canopy Density in the Big Meadows Area of Shenandoah National Park

Map of Tree Heights in the Big Meadows Area of Shenandoah National Park

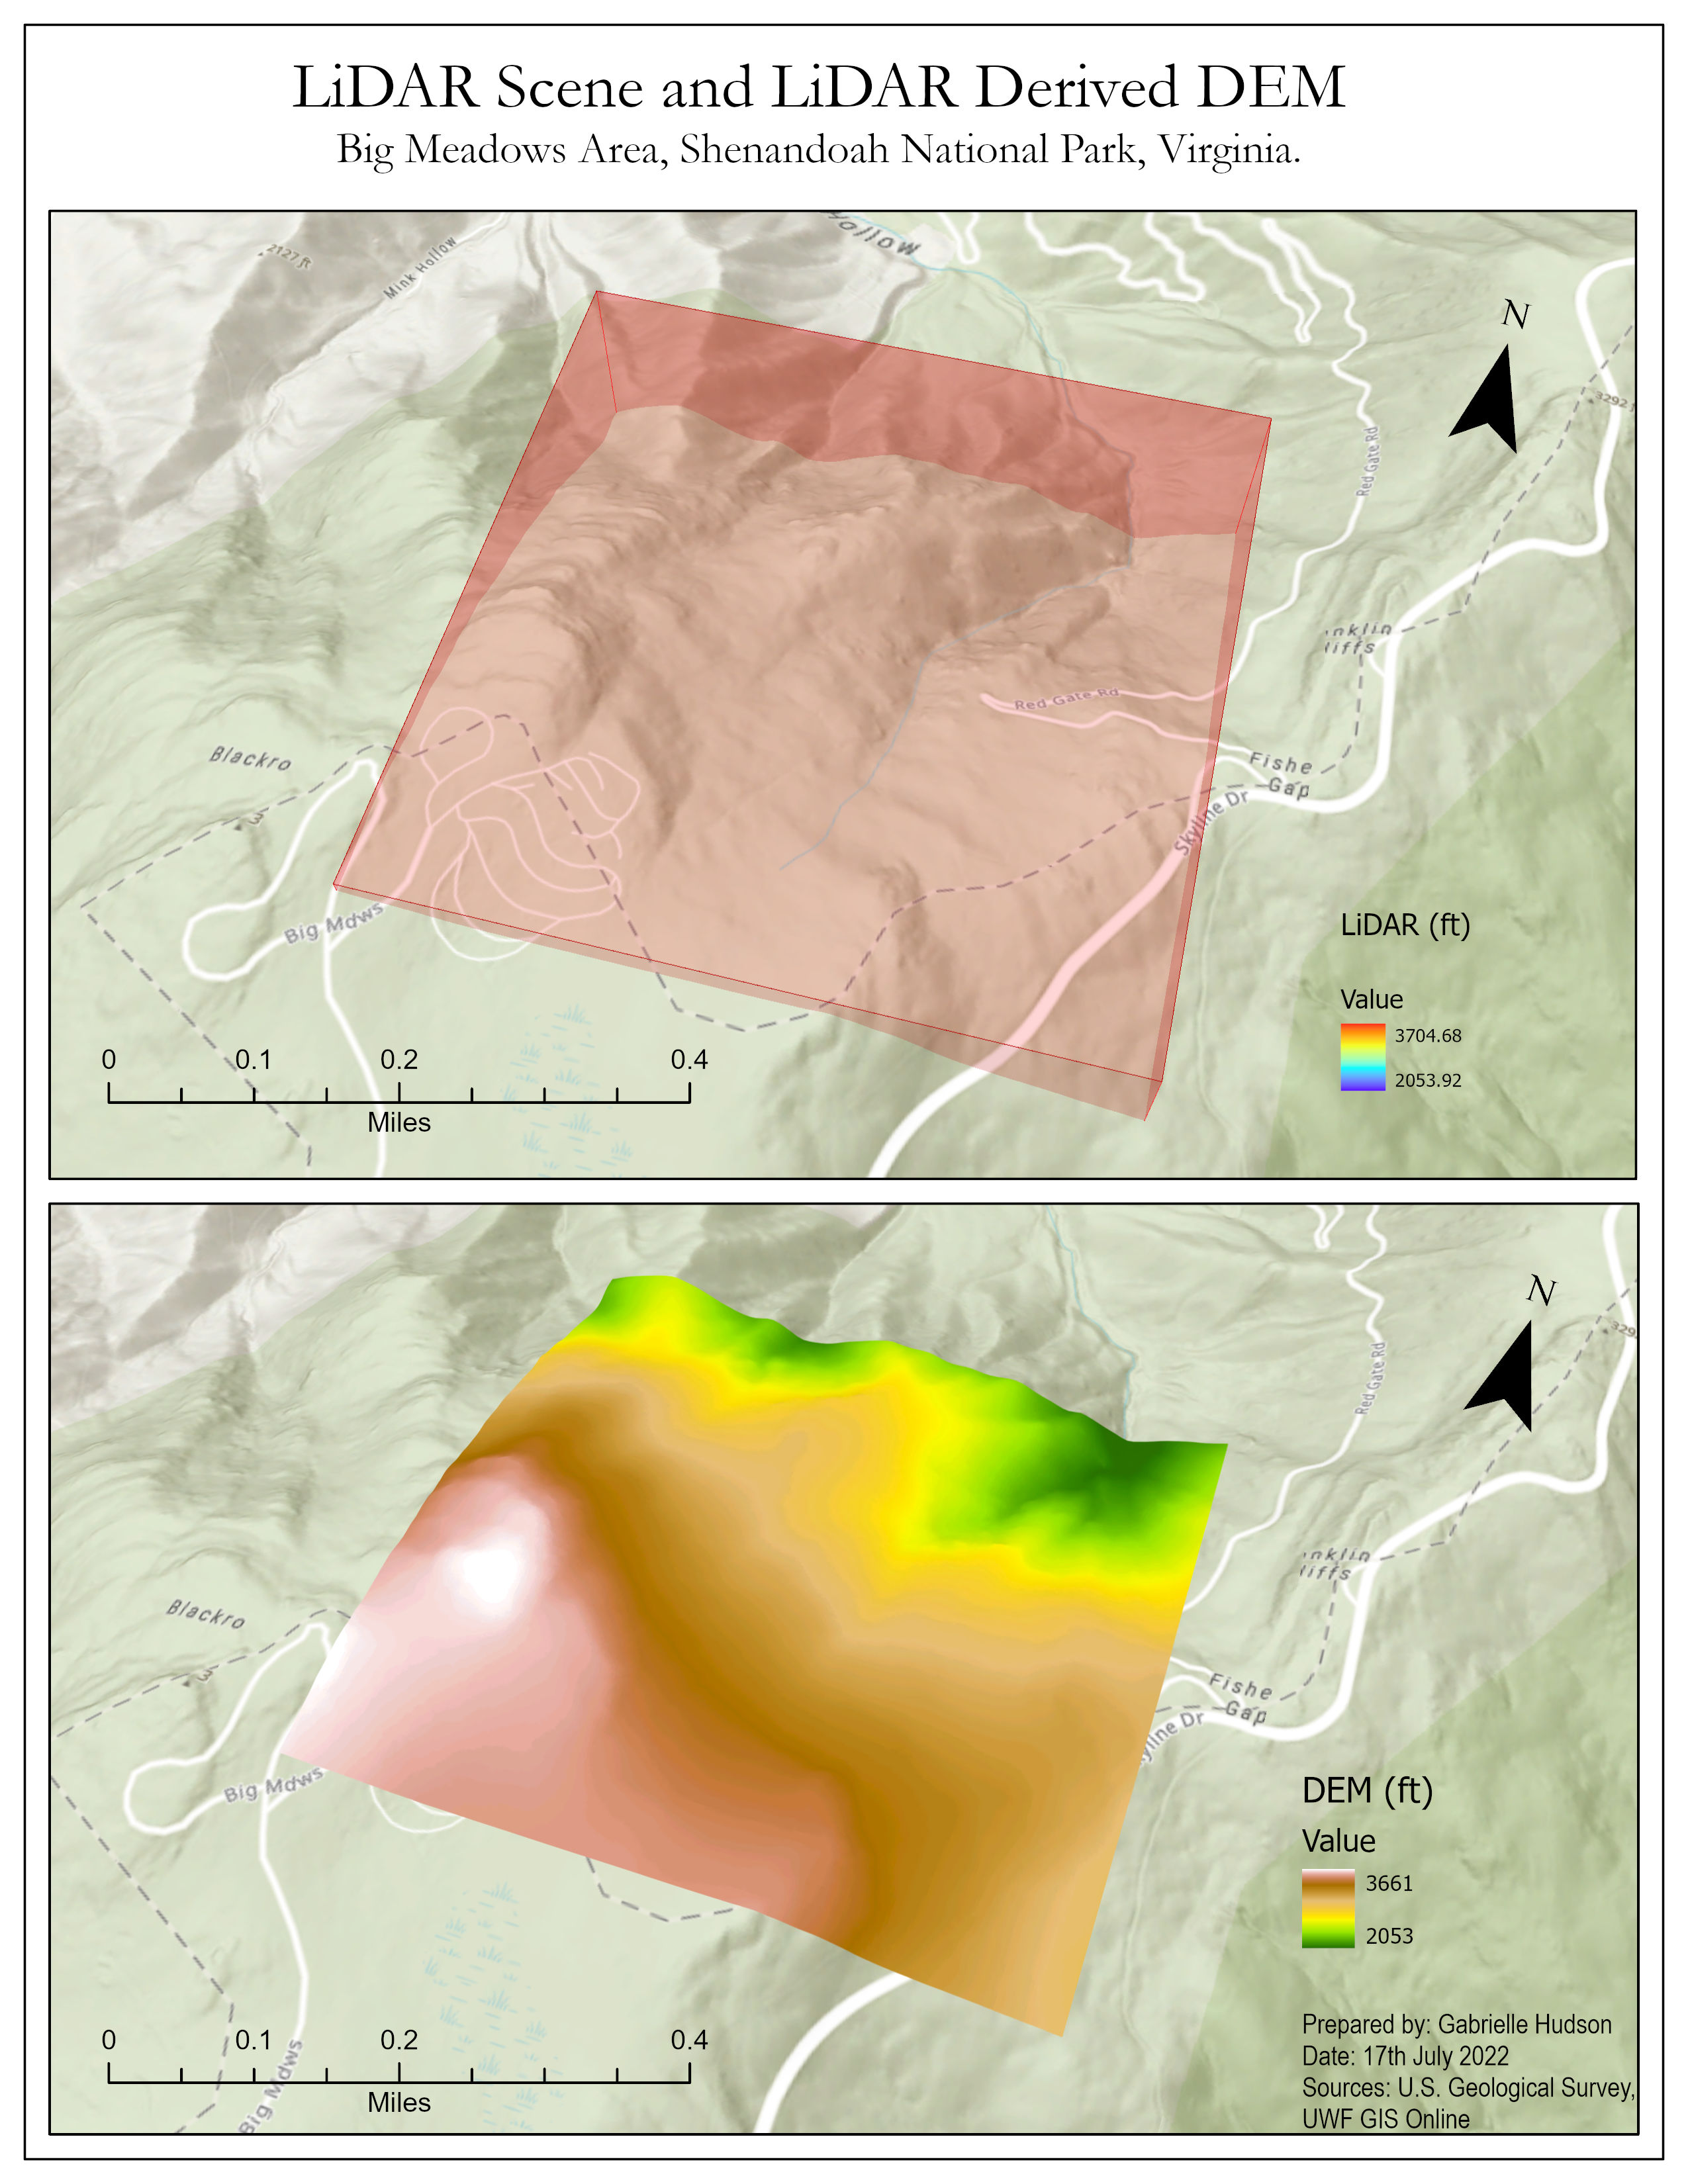
LiDAR Scene and LiDAR Derived DEM in the Big Meadows Area of Shenandoah National Park

While I enjoyed working with LiDAR data, exploring data in 3D and learning of its power in analysis, this type of data requires hardware that can handle large amounts of processing. When creating the last map, which displays the LiDAR scene, the LiDAR data does not display properly. The only thing that appears is the bounding box for the LiDAR data. The data displayed in the map tab (view) but it seems that the computer I used and the internet speed prevented the LiDAR from also displaying in the layout tab (view). It also displays in the layout tab (view) when zoomed in but this is not conducive the the map product being esthetically pleasing or viewing the data comprehensively on the map. I will continue to try to find alternative ways to get the data to display properly. Below is a screen grab of the lidar data in the map tab (view) for reference. 


Comments

Popular posts from this blog

GIS 5935 - Data Quality Assessment

GIS 5935 - Surfaces - TINs and DEMs

GIS 5100 - Who is Gabrielle Hudson?